Rainbow Height Map Noise (Animated) (Still)

This is my contribution to the OBJKT4OBKT2 free art swap (at the Hic et Nunc crypto art NFT market). Since I arrived late, I'll keep it priced free an extra day.

Rainbow Height Map Noise (Animated) (Still)

Available at: https://www.hicetnunc.xyz/objkt/48189

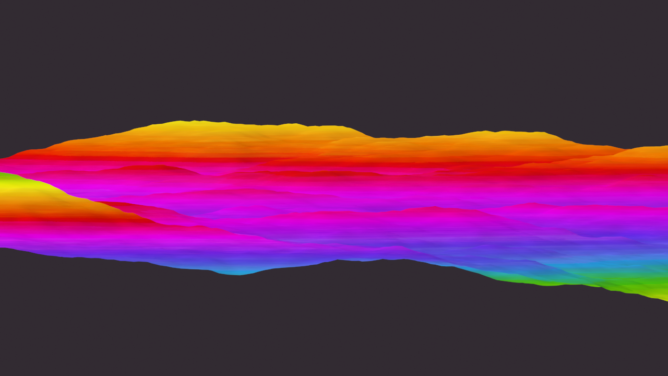
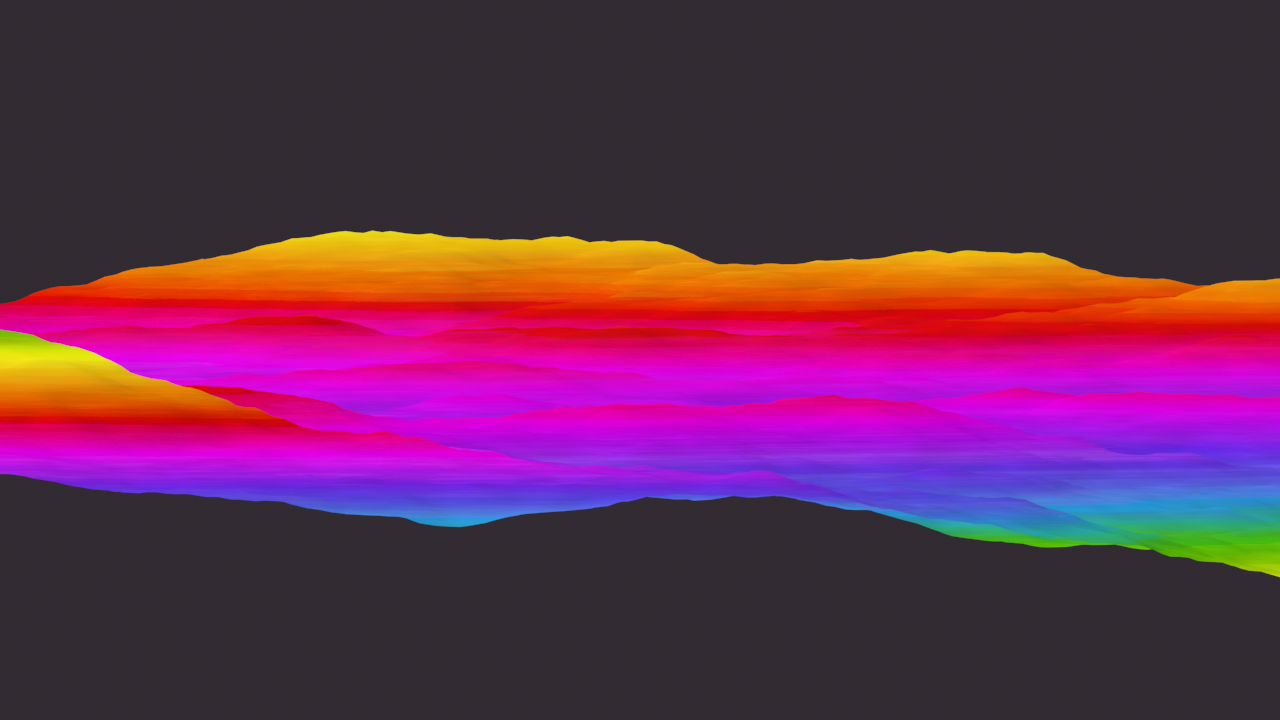
Description: Take a 3D plane and subdivide it to small squares. Apply animated noise to it on the Z axis. Take a gradient of maximum chroma and medium lightness colors, similar to a rainbow, and map it to the elevation view of the noisy plane. Then render the animation, and you get something like this. This could be compared to a geographic elevation map, but with color gradients between lines. It could also be compared to a representation of earth layer evolution.

You need a little bit of Tezos–a newfangled eco-friendly cryptocurrency–to cover the tiny transaction fee to collect free art as part of this art swap. You can get Tezos via the Guarda online wallet and other places, and I recommend the Kukai or Temple web wallets. (If you create your wallet in Guarda, export the private key and import it to the web wallets to access it.)

Thanks to @DiverseNftArt for organizing this event (that's a link to their announce tweet).

average of diff and average views of satellite photos of the Earth

This is one of thousands of images like it (each unique though) I've recently generated with an experimental process. The experiment is a success if I may say so.

This is the process to (potentially) get some way cool procedural images from satellite (or any!) images, accomplished with a new script at https://github.com/earthbound19/_ebArt/blob/master/recipes/diff_avg_supercomposites.sh :

Phase I.
– collect several cool satellite images of civilization and/or wilderness, e.g. from this site: https://earthview.withgoogle.com/
– for every image pair in the collection, make a "diff" image (subtract the RGB values of every pixel in one image from every pixel in the other image), and save the result
– for every image pair in the collection, make an averaged image (average the RGB values of every pixel in one image with another), and save the result
Phase II.
– liberally delete less impressive results
Phase III.
– for every diffed result, average it with an averaged result and save that.
– for every averaged result, subtract (diff) a diffed result.
– liberally delete less impressive results. Good luck–with 17 source images and heavy pruning in Phase II, this will give me 17k+ results, so far all of them compellingly cool.

(Phase IV: sort all results by approx. nearest most similar and string them together in a movie of crossfades to see works between the works.)

(Phase V: accidentally produce glitch art because your computer ran out of hard drive space and memory doing all this, but the processing script keeps calling the utilities that do this, and the utilities break. I'll post some glitch results later).

(Phase VI: realize you have a storage and bandwidth problem for your new many gigabytes of images.)