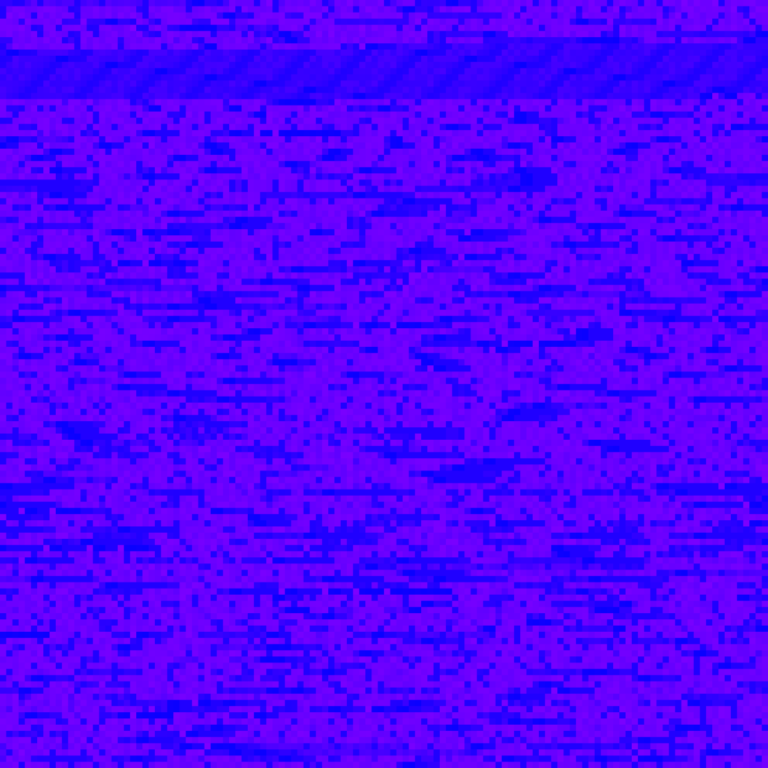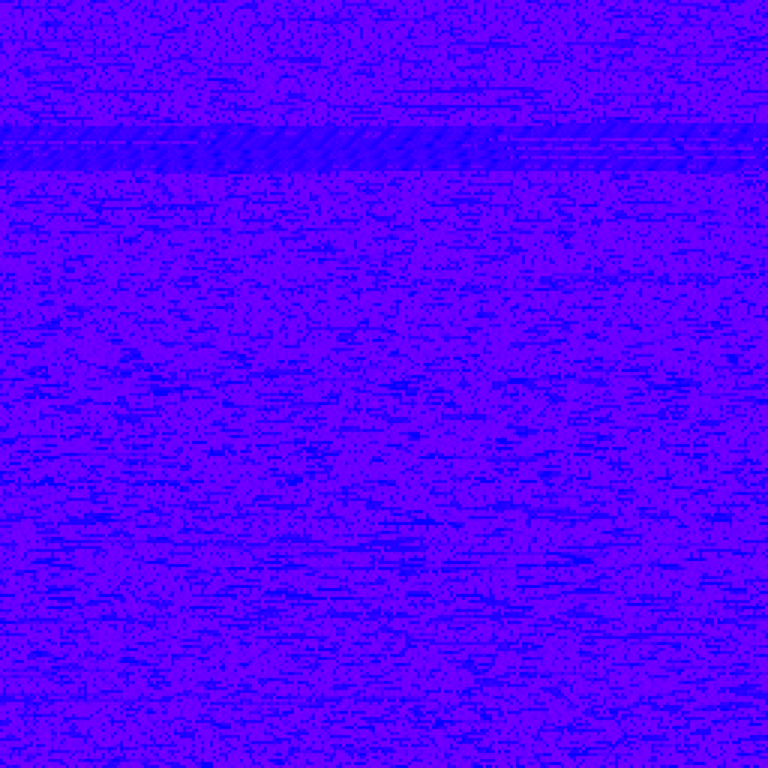

These images and this animation (there may only be one image if you're reading a syndicated post) are ways of representing snapshots and evolution of source code. The source code of the second image is version 1.2.0 of a Processing script (or program or code) which produces generative art. At this writing, a museum install of that generative-art-producing-program is spamming twitter to death (via twitter.com/earthbound19bot) every time a user interacts with it. The generative art is entitled "By Small and Simple Things" (is twitter overwhelmed) generative art (see earthbound.io/blog/by-small-and-simple-things-digital-generative/).
How did I represent the source code of a generative art program as an image? There are ways. Another word for creating images from arbitrary data is "data bending," meaning taking data intended for one purpose and using it or representing it via other common ways of using data. One form of data bending is text to image; that's what I do here.
But the ways to represent code as a "data bent" image which I found when I googled it, I didn't like, so I made my own.
The approach I don't like is to take every three bytes (every 8 zeros or ones) in a source and turn them into RGB values (three values from 0 to 255 for Red, Green and Blue–the color components of almost all digital images you ever see on any screen). Conceptually that doesn't model anything about the data as an image other than confused randomness, and aesthetically, it mostly makes random garish colors (I go into the problems of random RGB colors in this post: earthbound.io/blog/superior-color-sort-with-ciecam02-python/).
A way I like better to model arbitrary data as an image is to map the source data bytes into _one channel_ of RGB, where that one channel fluctuates but the others don't. This has the effect of gauging low and high data points by color intensity or limited variation. In these data bent images here, the green and blue values don't change, but the red ones do. Green is zero, blue is full, and the changes in the source data (mapped to red) make the blue alternate from blue (all blue, no red) to violet (all blue, all red).
My custom script that maps data to an image creates a PPM image from any source data (PPM is a text file that describes pixels). The PPM can be converted to other formats by many image tools (including command line tools and photoshop). This data to image script is over here: github.com/earthbound19/_ebDev/blob/master/scripts/imgAndVideo/data_bend_2PPMglitchArt00padded.sh
Again, the first image here (or maybe not if you're reading a syndicated copy of this post) is the first version of By Small and Simple Things. The second image is from the latest (at this writing). The animation is everything in between, assembled via this other script over here: github.com/earthbound19/_ebArt/blob/master/recipes/mkDataBentAnim.sh